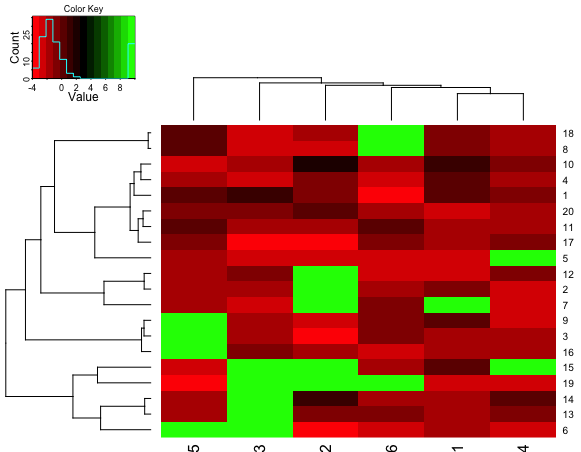
Rでヒートマップをつくる
ゲノム解析論文では頻出のheatmap(ヒートマップ)をRを用いて作ってみた。各種パッケージがあるようなので、色の設定とあわせて記しておく。
heatmapを使ってみる
n1<-6
n2<-20
x<-matrix(rnorm(n1*n2),ncol=n1)
x[sample(1:length(x),20)]<-10
heatmap(x)

colorRampPalette関数を用いて自分の色グラデーションを作る
my.col1 <- colorRampPalette(c("red","white","black")) #赤と黒でパレットを作成する
heatmap(x, col=my.col1(256))

色から自分で作成する
col1<-rgb(0.7, 0.5, 0.2, 0.7) #色は RGB alphaで0-1の値で指定できる。
col2<-rgb(0.2, 0.5, 0.7, 0.7)

my.col2 <- colorRampPalette(c(col1,"white",col2))
heatmap(x, col=my.col2(256))

出来合いの色を使うのであれば、heat.colors, topo.colors, terrain.colors, cm.colors, (gplots内の)redgreenなどがある
heatmap(x, col=cm.colors(256))

heatmap.2 (gplotパッケージ)
library(gplots)
heatmap.2(x, col=redgreen(256))

heatmap.3 (GMDパッケージ)
library(GMD)
heatmap.3(x, trace="none", dendrogram="both", Rowv=T, Colv=T, color.FUN="redgreen", cluster.by.row=T, cluster.by.col=T, mapratio=1, mapsize=4, main="")

heatmap.plus
library(heatmap.plus)
heatmap.plus(x, col=my.col1(256))

References
- heatmap()
http://stat.biopapyrus.net/graph/heatmap.html - 統計グラフの色
https://oku.edu.mie-u.ac.jp/~okumura/stat/colors.html - 色見本
http://www.okadajp.org/RWiki/?%E8%89%B2%E8%A6%8B%E6%9C%AC - Rにおける色の名前 http://www.okadajp.org/RWiki/?R%E3%81%AB%E3%81%8A%E3%81%91%E3%82%8B%E8%89%B2%E3%81%AE%E5%90%8D%E5%89%8D
- heatmap 関数について調べてみた
http://panda-nikki.hatenablog.jp/entry/20131209/1386600203