火山爆発指数 VEI (Volcano Explosivity Index)
VEI 8について
- 1982年にNewhall & Selfにより、提案された火山の区分。
- 0-8まであり、VEI (Volcano Explosivity Index)と呼ばれる。
- 区分は、噴出物の量Ejecta volumeによってなされる。
逆に「肩書」を気にする〜当該地域の関係者でないのでは?と指摘された話

今日は研究発表における反省例を。
私は、京都と福島で診療をしています。
地域で色々と活動していると、
「組織」としてよりは、「個人」としての活動が増え、
肩書も増えてきます。
私は、東日本大震災被災地の地域医療の研究を行っているのですが、
とある研究論文を提出していた際に、査読者から以下のような返事が来ました。

[意訳] 重要な報告でした(中略). しかし、日本の有名大学である京都大学に所属する医師からの報告で、自分本意な意見が内容に盛り込まれていました. (以下略).
非常に厳しいご指摘です・・・
当然、私も直接携わってる上、現地の方々との共同研究だったのですが、
連絡著者が京都だったことに違和感を覚えられたようでした。
これに対して誠実に返答し、後日、無事に受理されました!!(ありがとうございます。)
査読者からすると、福島のことを京都の人間が述べていると、あまりに離散的だったのでしょう。
解釈の妥当性を問われた形です。
良い査読者でした。
色々と活動していると、
実務上は「所属」は、あまり関係なくなってくるのですが、
対外的には「立て付け」を気にした方が良いです。
最近は、「内(内容)と外(発信元の肩書)との連続性」を意識しています。
このあたりは、チームビルディングでも重要です。
論文投稿注意書き[New submission状態の持続]
論文投稿の際に、"New submission"がずっと続いている場合、著者確認がなされていない可能性があります。
通常は"Editor assigned"や"Under review"などに変わります。
ご注意を。
公開データセット集・解析方法集
忘備録に。
統計、機械学習関係の教育機関サイト
DataSets < Main < Vanderbilt Biostatistics Wiki
UCI Machine Learning Repository
Centre for Multilevel Modelling | Centre for Multilevel Modelling | University of Bristol
Purdue Statistics : Michael Levine : Home
R-bloggers | R news and tutorials contributed by (750) R bloggers
Misleading Graphs | Passy's World of Mathematics
Identifying and Avoiding Bias in Research. Christopher J. Pannucci, MD and Edwin G. Wilkins, MD MS
Hall : A Short Prehistory of the Bootstrap
An introduction to statistical learning with application in R
Elements of Statistical Learning: data mining, inference, and prediction. 2nd Edition.
Learning from Imbalanced Classes - Silicon Valley Data Science
Practical Guide to deal with Imbalanced Classification Problems in R
Machine learning
A Complete Tutorial on Tree Based Modeling from Scratch (in R & Python)
An Introduction to Recursive Partitioning Using the RPART Routines
Miscellaneous
種々のオープンデータ
追記していきます。
Rでダイアグラムを作成する
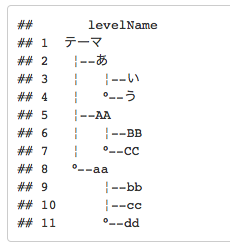
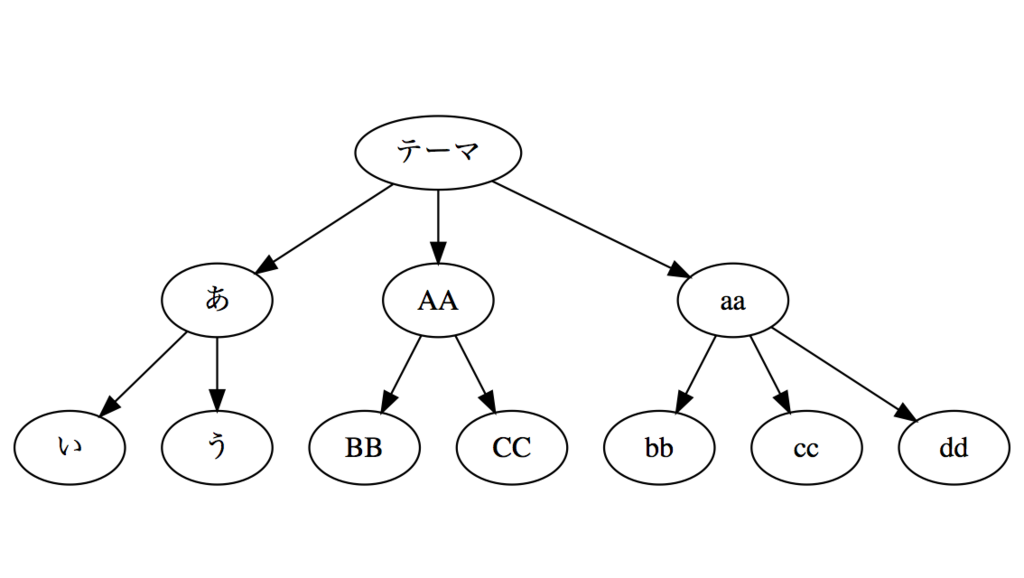
質的研究におけるCoding Tree
library(data.tree)

theme <- Node$new("テーマ")
category1 <- theme$AddChild("あ")
code1 <- category1$AddChild("い")
code2 <- category1$AddChild("う")
category2 <- theme$AddChild("AA")
code3 <- category2$AddChild("BB")
code4 <- category2$AddChild("CC")
category3 <- theme$AddChild("aa")
code5 <- category3$AddChild("bb")
code6 <- category3$AddChild("cc")
code7 <- category3$AddChild("dd")

print(theme)

plot(theme)
以下を参考にさせていただきました。
Introduction to data.tree


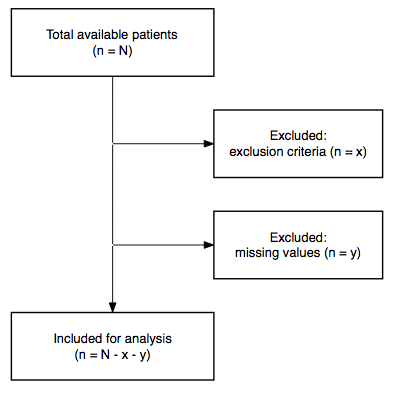
CONSORTやSTROBEのダイアグラムを作成する
以下を参考にさせていただきました。
Danny Wong · STROBE/CONSORT Diagrams in R

library(DiagrammeR) #DiagrammeR
library(DiagrammeRsvg) #保存用
library(rsvg) #保存用

#Set the values which will go into each label.
a1 <- 'Total available patients\n(n = N)'
b1 <- ''
c1 <- ''
d1 <- 'Included for analysis\n(n = N - x - y)'
e1 <- ''
a2 <- ''
b2 <- 'Excluded: \nexclusion criteria (n = x)'
c2 <- 'Excluded: \nmissing values (n = y)'
d2 <- ''
e2 <- ''

#Create a node dataframe
ndf <- create_node_df(
  n = 10,
  label = c(a1, b1, c1, d1, e1, #Column 1
            a2, b2, c2, d2, e2), #Column 2
  style = c('solid', 'invis', 'invis', 'solid', 'invis', #Column 1
            'invis', 'solid', 'solid', 'invis', 'invis'), #Column 2
  shape = c('box', 'point', 'point', 'box', 'box', #Column 1
            'plaintext', 'box', 'box', 'point', 'point'), #Column 2
  width = c(3, 0.001, 0.001, 3, 3, #Column 1
            2, 2.5, 2.5, 0.001, 0.001), #Column 2
  height = c(1, 0.001, 0.001, 1, 1, #Column 1
             1, 1, 1, 0.001, 0.001), #Column 2
  fontsize = c(rep(14, 10)),
  fontname = c(rep('Helvetica', 10)),
  penwidth = 1.5,
  fixedsize = 'true')

#Create an edge dataframe
edf <- create_edge_df(
  from = c(1, 2, 3, 4, #Column 1
           6, 7, 8, 9, #Column 2
           2, 3 #Horizontals
  ),
  to = c(2, 3, 4, 5, #Column 1
         7, 8, 9, 10, #Column 2
         7, 8 #Horizontals
  ),
  arrowhead = c('none', 'none', 'normal', 'none', #Column 1
                'none', 'none', 'none', 'none', #Column 2
                'normal', 'normal' #Horizontals
  ),
  color = c('black', 'black', 'black', '#00000000', #Column 1
            '#00000000', '#00000000', '#00000000', '#00000000', #Column 2
            'black', 'black' #Horizontals
  ),
  constraint = c(rep('true', 8), #Columns
                 rep('false', 2) #Horizontals
  )
)

g <- create_graph(ndf,
                  edf,
                  attr_theme = NULL)

#export_graph(g, file_name = "Study Flow.png") #保存する

render_graph(g)
http://www.ec.kansai-u.ac.jp/user/arakit/documents/diagram_vignette.pdf
評価者間信頼性(検者間信頼性) inter-rater reliabilityをRで算出する
IRRとは
inter-rater reliability の略であり、
日本語では、評価者間信頼性となる。
評価者間信頼性
評価者間信頼性(検者間信頼性)は、2人以上の評価者が同じ対象を評価した場合の一致度です
評価者内信頼性
評価者内信頼性、検査者内信頼性は、同一評価者が2回以上繰り返し評価した場合の一致度です。
級内相関係数
級内相関係数 : Intraclass Correlation Coefficients:ICC を用いて、信頼性を表すことが多い。
実装
Package ‘irr’ を用いて実装できる。
install.packages("irr") #パッケージをインストール
library(irr) #パッケージを読み込む
data<-read.table("hoge") #読みたいファイルを指定する
agree(data) #単純一致率
kappa2(data) #カッパ計数
kripp.alpha(data) #クリッペンドルフのα
