Rでダイアグラムを作成する
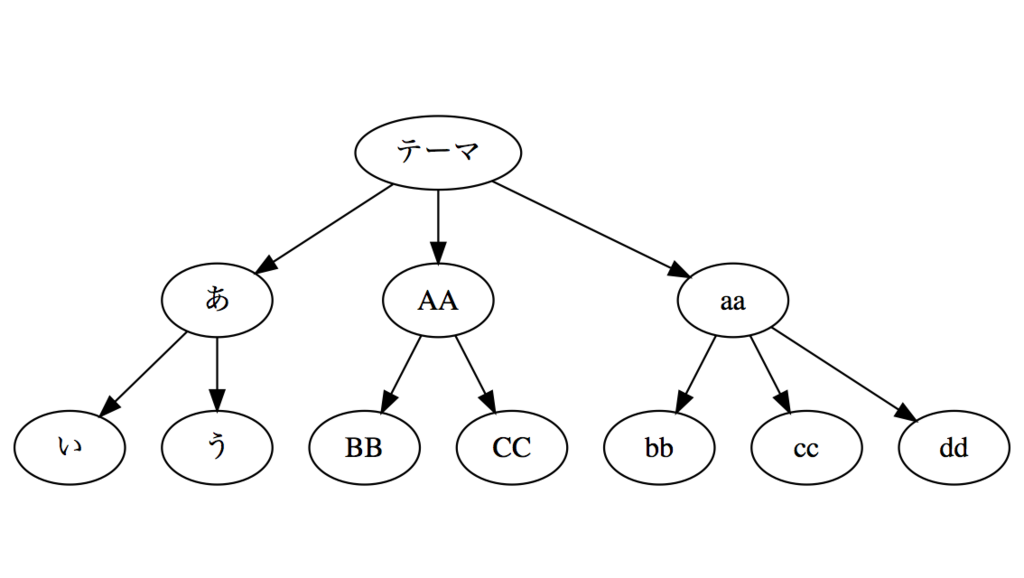
質的研究におけるCoding Tree
library(data.tree)

theme <- Node$new("テーマ")
category1 <- theme$AddChild("あ")
code1 <- category1$AddChild("い")
code2 <- category1$AddChild("う")
category2 <- theme$AddChild("AA")
code3 <- category2$AddChild("BB")
code4 <- category2$AddChild("CC")
category3 <- theme$AddChild("aa")
code5 <- category3$AddChild("bb")
code6 <- category3$AddChild("cc")
code7 <- category3$AddChild("dd")

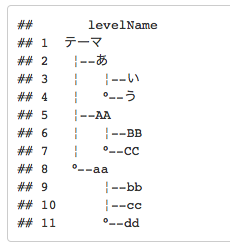
print(theme)

plot(theme)
以下を参考にさせていただきました。
Introduction to data.tree


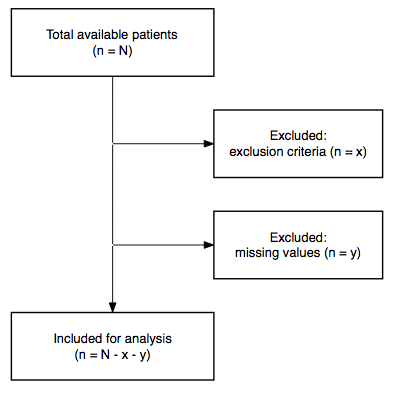
CONSORTやSTROBEのダイアグラムを作成する
以下を参考にさせていただきました。
Danny Wong · STROBE/CONSORT Diagrams in R

library(DiagrammeR) #DiagrammeR
library(DiagrammeRsvg) #保存用
library(rsvg) #保存用

#Set the values which will go into each label.
a1 <- 'Total available patients\n(n = N)'
b1 <- ''
c1 <- ''
d1 <- 'Included for analysis\n(n = N - x - y)'
e1 <- ''
a2 <- ''
b2 <- 'Excluded: \nexclusion criteria (n = x)'
c2 <- 'Excluded: \nmissing values (n = y)'
d2 <- ''
e2 <- ''

#Create a node dataframe
ndf <- create_node_df(
  n = 10,
  label = c(a1, b1, c1, d1, e1, #Column 1
            a2, b2, c2, d2, e2), #Column 2
  style = c('solid', 'invis', 'invis', 'solid', 'invis', #Column 1
            'invis', 'solid', 'solid', 'invis', 'invis'), #Column 2
  shape = c('box', 'point', 'point', 'box', 'box', #Column 1
            'plaintext', 'box', 'box', 'point', 'point'), #Column 2
  width = c(3, 0.001, 0.001, 3, 3, #Column 1
            2, 2.5, 2.5, 0.001, 0.001), #Column 2
  height = c(1, 0.001, 0.001, 1, 1, #Column 1
             1, 1, 1, 0.001, 0.001), #Column 2
  fontsize = c(rep(14, 10)),
  fontname = c(rep('Helvetica', 10)),
  penwidth = 1.5,
  fixedsize = 'true')

#Create an edge dataframe
edf <- create_edge_df(
  from = c(1, 2, 3, 4, #Column 1
           6, 7, 8, 9, #Column 2
           2, 3 #Horizontals
  ),
  to = c(2, 3, 4, 5, #Column 1
         7, 8, 9, 10, #Column 2
         7, 8 #Horizontals
  ),
  arrowhead = c('none', 'none', 'normal', 'none', #Column 1
                'none', 'none', 'none', 'none', #Column 2
                'normal', 'normal' #Horizontals
  ),
  color = c('black', 'black', 'black', '#00000000', #Column 1
            '#00000000', '#00000000', '#00000000', '#00000000', #Column 2
            'black', 'black' #Horizontals
  ),
  constraint = c(rep('true', 8), #Columns
                 rep('false', 2) #Horizontals
  )
)

g <- create_graph(ndf,
                  edf,
                  attr_theme = NULL)

#export_graph(g, file_name = "Study Flow.png") #保存する

render_graph(g)
http://www.ec.kansai-u.ac.jp/user/arakit/documents/diagram_vignette.pdf